Overview
The Overview tab in the FlexiFunnels dashboard provides a real-time snapshot of your funnel's daily performance. Use it to review sales, revenue, affiliate payouts, visitor activity, and funnel efficiency from one central location.
Before You Begin
- Sign in to your FlexiFunnels account.
- Ensure that your funnel, sales pages, checkout pages, and payment settings are configured.
- Confirm the currency you want to use when reviewing financial metrics.
Step 1: Review the Time Filters
Use the time filters at the top of the Overview dashboard to change the reporting period. Each filter updates the displayed metrics for the selected timeframe.
- Today: Displays the current day's performance and is the default view.
- Yesterday: Displays performance from the previous day.
- This Week: Displays cumulative performance for the current week.
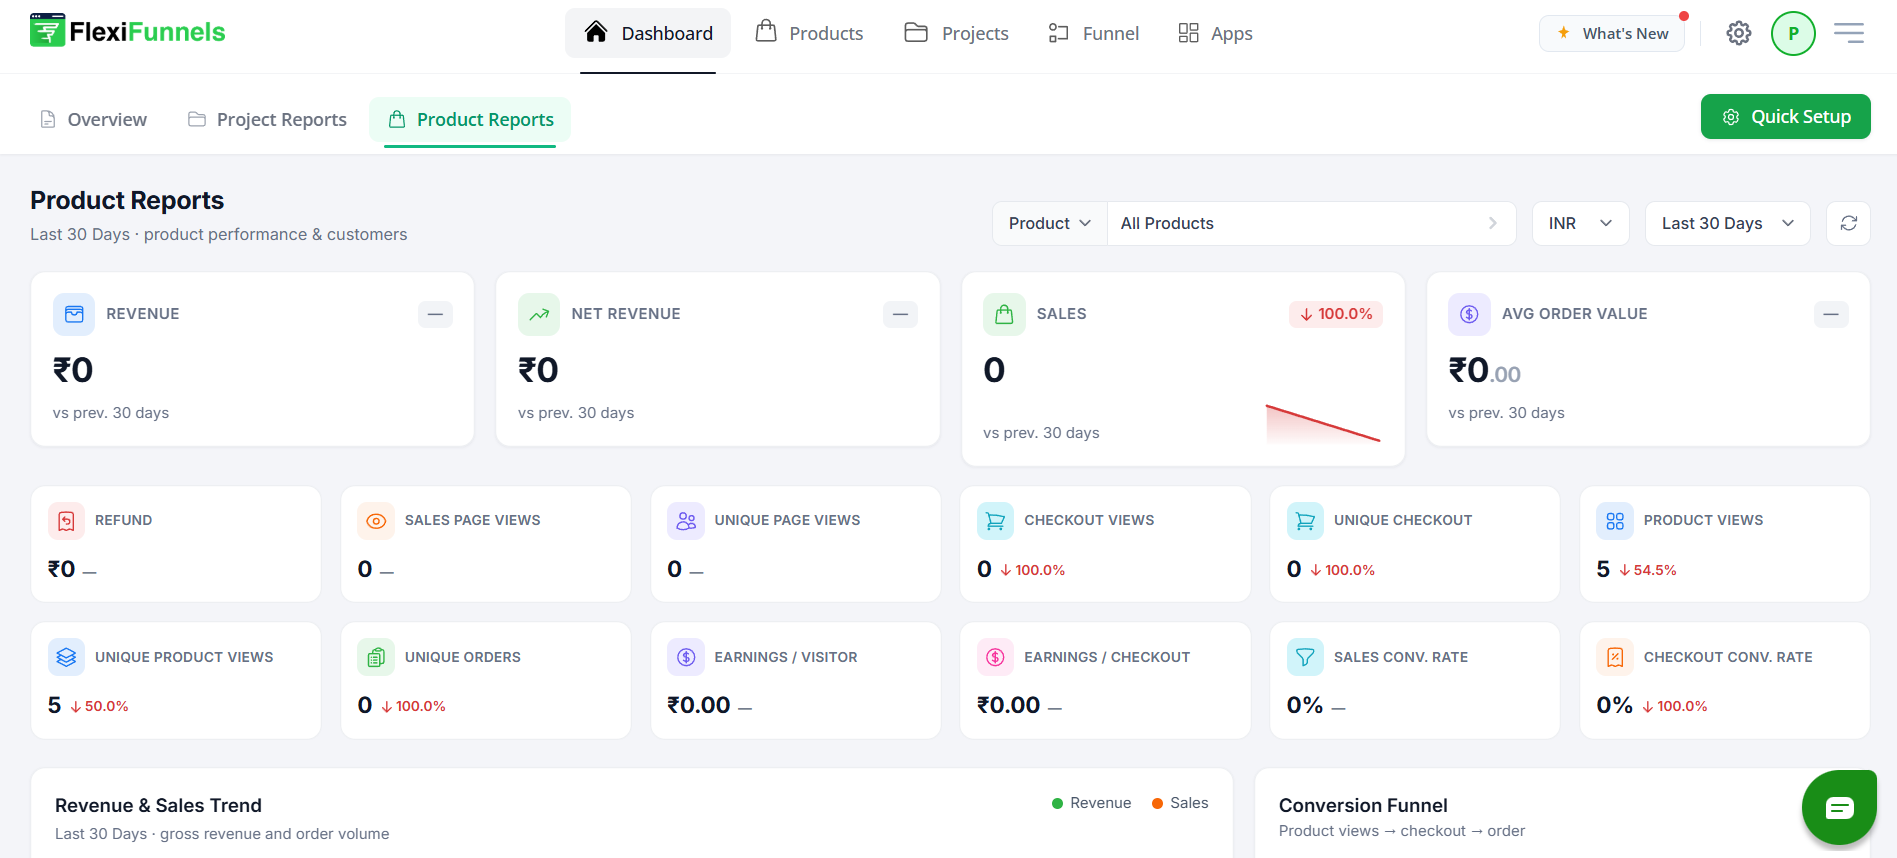
Step 2: Review the Sales Performance Summary
The sales summary shows the financial results for the selected timeframe.
- Total Sales: The number of completed transactions.
- Gross Revenue: The total revenue generated before deductions.
- Net Revenue: The revenue remaining after deductions.
- Paid to Affiliate: The amount paid to affiliate partners.
- Your Daily Profit: Your actual earnings for the selected day or period.
Use these values to understand total earnings, deductions, affiliate payouts, and profitability.
Step 3: Review Traffic and Engagement Metrics
The traffic section shows how visitors interact with your funnel before completing a purchase.
- Sales Page Views: The total number of times the sales page was viewed.
- Unique Visitors: The number of distinct users who visited your funnel.
- Checkout Views: The number of users who reached the checkout page.
- Earnings Per Visitor (EPV): Total earnings divided by the number of visitors. This indicates how efficiently the funnel generates revenue from traffic.
Step 4: Select the Currency
Use the currency dropdown in the top-right corner to change how financial metrics are displayed. For example, you can select INR (₹) when reviewing revenue in Indian rupees.
Use the Overview Dashboard To
- Monitor sales performance in real time.
- Compare visitors, checkout activity, and completed sales.
- Measure funnel profitability per visitor.
- Understand how affiliate commissions affect revenue.
Verify the Configuration
Switch between Today, Yesterday, and This Week to confirm that the dashboard updates the reported values. Change the currency and verify that the financial metrics are displayed in the selected currency. Compare traffic, checkout, sales, and profit values to confirm that the funnel is reporting activity correctly.
Common Scenarios
- Daily performance review: Select Today to monitor current sales, visitors, and profit.
- Previous-day comparison: Select Yesterday to review the previous day's results.
- Weekly reporting: Select This Week to review cumulative performance.
- Affiliate analysis: Compare gross revenue, net revenue, and affiliate payouts.
- Funnel optimization: Compare sales-page views, unique visitors, checkout views, and total sales to identify drop-off points.
Best Practices
- Review the Overview dashboard at the same time each day for consistent reporting.
- Use the same timeframe when comparing performance between periods.
- Compare unique visitors with total sales to understand conversion efficiency.
- Monitor checkout views to identify potential purchase-stage drop-offs.
- Review EPV to measure the value generated by your traffic.
- Check affiliate payouts when analyzing net profit.
- Confirm the currency before recording or sharing financial results.
Before Contacting Support
- Confirm that the correct time filter is selected.
- Verify that the selected currency is correct.
- Refresh the dashboard and review the metrics again.
- Confirm that your sales and checkout pages are configured correctly.
- Check that completed transactions and affiliate payouts are recorded as expected.
Expected Outcome
The Overview dashboard provides an up-to-date view of your funnel's sales, revenue, profit, traffic, checkout activity, and earnings per visitor. You can use these metrics to monitor daily performance and make informed funnel and marketing decisions.
Was this article helpful?
That’s Great!
Thank you for your feedback
Sorry! We couldn't be helpful
Thank you for your feedback
Feedback sent
We appreciate your effort and will try to fix the article